GASTON’S STORY
To understand Gaston’s story and others like his it is important to understand how assessments are used. Assessments are required annually in all Federally and State-funded education systems. Assessments were created and used broadly to measure the ability to a standard and commonly used to place people in a level of support. Most Americans have experienced assessments as tests to determine grade level for example.
Assessments are used in Federal and State-funded service programs after a person with a diagnosis of Intellectual Disability (ID) turns 22 and ages out of public school. At this point, they are used primarily to place a person in a level of assistance. According to the 2017 Disability Statistics Annual Report published by the Institute on Disability, University of New Hampshire, 12.8% or over 4.3 million people in the US have an intellectual disability. Gaston would be one.
Gaston’s story is presented as it occurred, following the steps of the implementation process of iASK.
Pre-assessment: A survey is completed to determine learners’ values and life goals
Gaston wanted to have a job. His team also wanted him to be able to navigate his community safely.
STEP 1 iASK Assessment Specialist reviews leaner’s history
Gaston was receiving pre-vocational services at an organization for over 12 years during which he completed several assessments. He participated in 4 different types of IQ tests: the Weschler Abbreviated Scales of Intelligence (WASI), the Weschler Intelligence Scale for Children (WISC, WISC-R), the Stanford-Binet Intelligence Test, and the Lieter International Performance Scale. The IQ tests determined consistently that Gaston met the criteria for moderate mental retardation.
According to his last WASI psychological evaluation, his cognitive and adaptive abilities had changed very little across repeat evaluations of his IQ scores. While these assessments were used to qualify Gaston to receive Jobs and Day Training services, they provided very little information about Gaston’s skills.
Gaston was also evaluated using the Vineland Adaptive Behavior Scales, his score placed him under the 1st percentile compared to others his age. This assessment indicated that Gaston needed help in the areas of communication and daily living skills. Notes in his training plan history consistently documented similar communication issues. The review of Gaston’s training plans and goals history also showed that Gaston’s “program” goals and steps for training, appeared to have stayed the same for over 2 years.
The Assessment Specialist conducted interviews with Gaston’s case manager. Gaston’s case manager identified several actions that presented barriers for Gaston. One of them was described as a general non-compliance with instructions related to finding an object pertaining to doing his job. Gaston also seemed to have trouble wayfinding, going to a location upon being instructed to do so. In Gaston’s case, his support team assumed that Gaston understood the instructions he was given. They identified his lack of follow-through as a motivational issue, as in, he just didn’t want to comply.
STEP 2 Given the data from prior assessments and interviews with the team, Skill Domains are selected
Gaston completed the iASK in the skills of Complex Verbal Behavior
STEP 3 Assessment plan approved by the team, Gaston completes Complex Verbal Behavior (CVB)
STEP 4 Initial analysis of CVB data completed to determine if additional domains are needed
No additional skill domains were selected in Gaston’s case
Gaston’s results in the area of Spatial Relations showed that he had little to no functional use (comprehension) of Spatial Relations. The assessment revealed that Gaston was unable to follow simple instructions because he did not understand the meaning of the words. If you had a skill deficit like Gaston’s and your co-worker or supervisor asked you to go pick up some boxes in the boss’s office, that might sound like blah blah blah blah boxes blah blah boss’s office. He could not interpret spatial relationship words. Gaston’s case manager and training staff were unaware of this deficit and assumed as stated, motivational issues were the reason he was “non-compliant.” Because Gaston didn’t understand the words used in various instructions, he would walk around seeming to comply and eventually sit back at his workstation. This was observed and reported as, “Gaston was wandering around.”
STEP 5 Learner Data is graphed, reported and discussed with Learner and their team
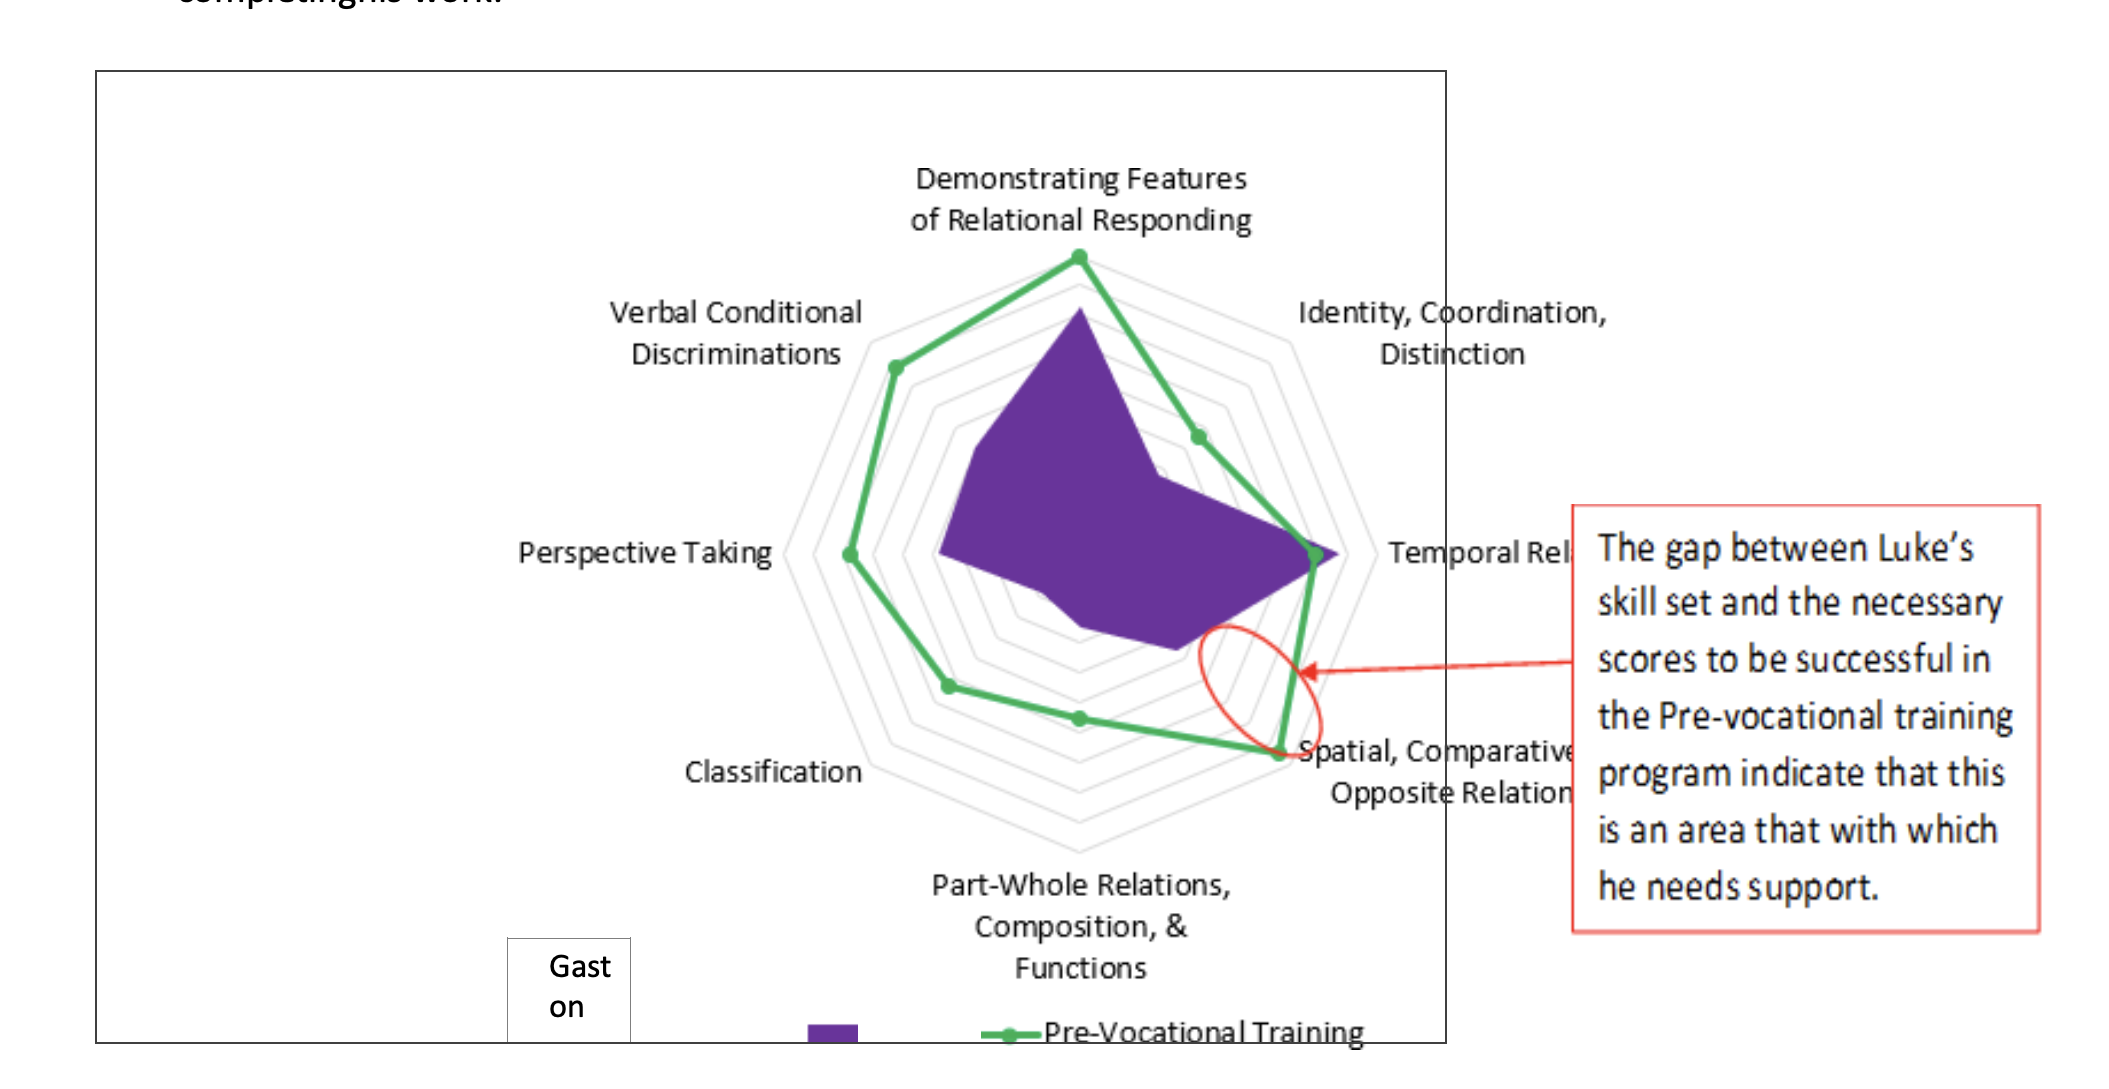
The report below is a SkillGram. It shows Gaston’s scores in each of the skill subdomains of Complex Verbal Behavior. His performance in each skill area appears as the purple shaded area. The green lines and dots are the levels of proficiency needed in each skill subdomain to perform a job. Notice how far away Gaston’s scores are for Spatial, Comparative, and Opposite Relations compared to his goal. These results shed new light on Gaston’s behavior when asked to “go get an item” for completing his work.

Step 6 Based upon iASK results, the Assessment Specialist generates a learning action plan for the provider or family that can be incorporated into the leaner’s plan
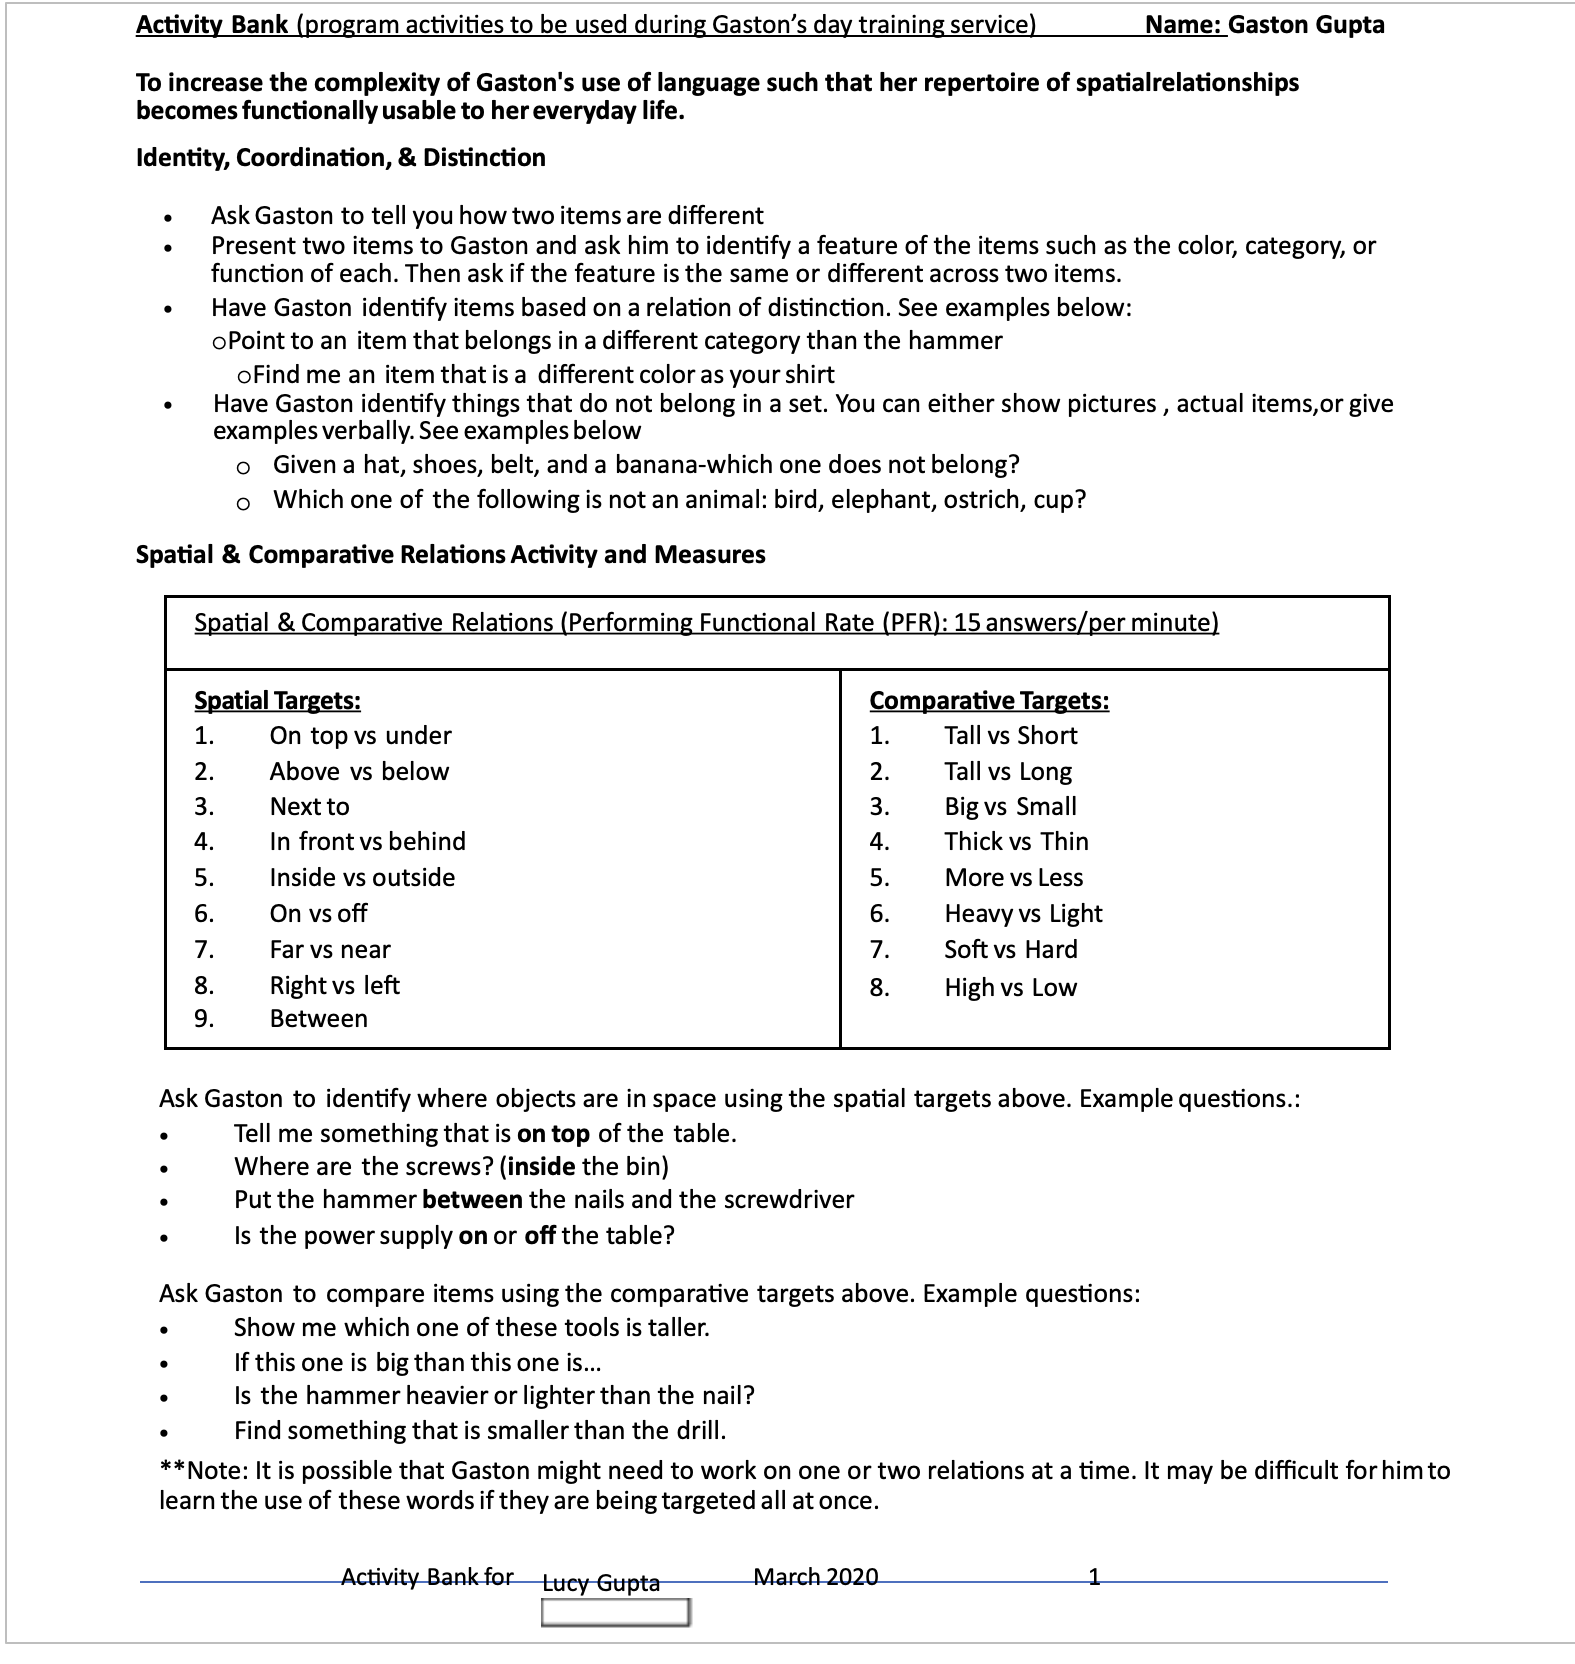
Gaston’s case manager and program team were provided with an “activity bank.” An Activity Bank is specific lessons or learning activities for Gaston. The Activity Bank includes how to conduct the training and tips to help Gaston succeed if he is challenged in his first attempts. Gaston’s Activity Bank appears on the next page.

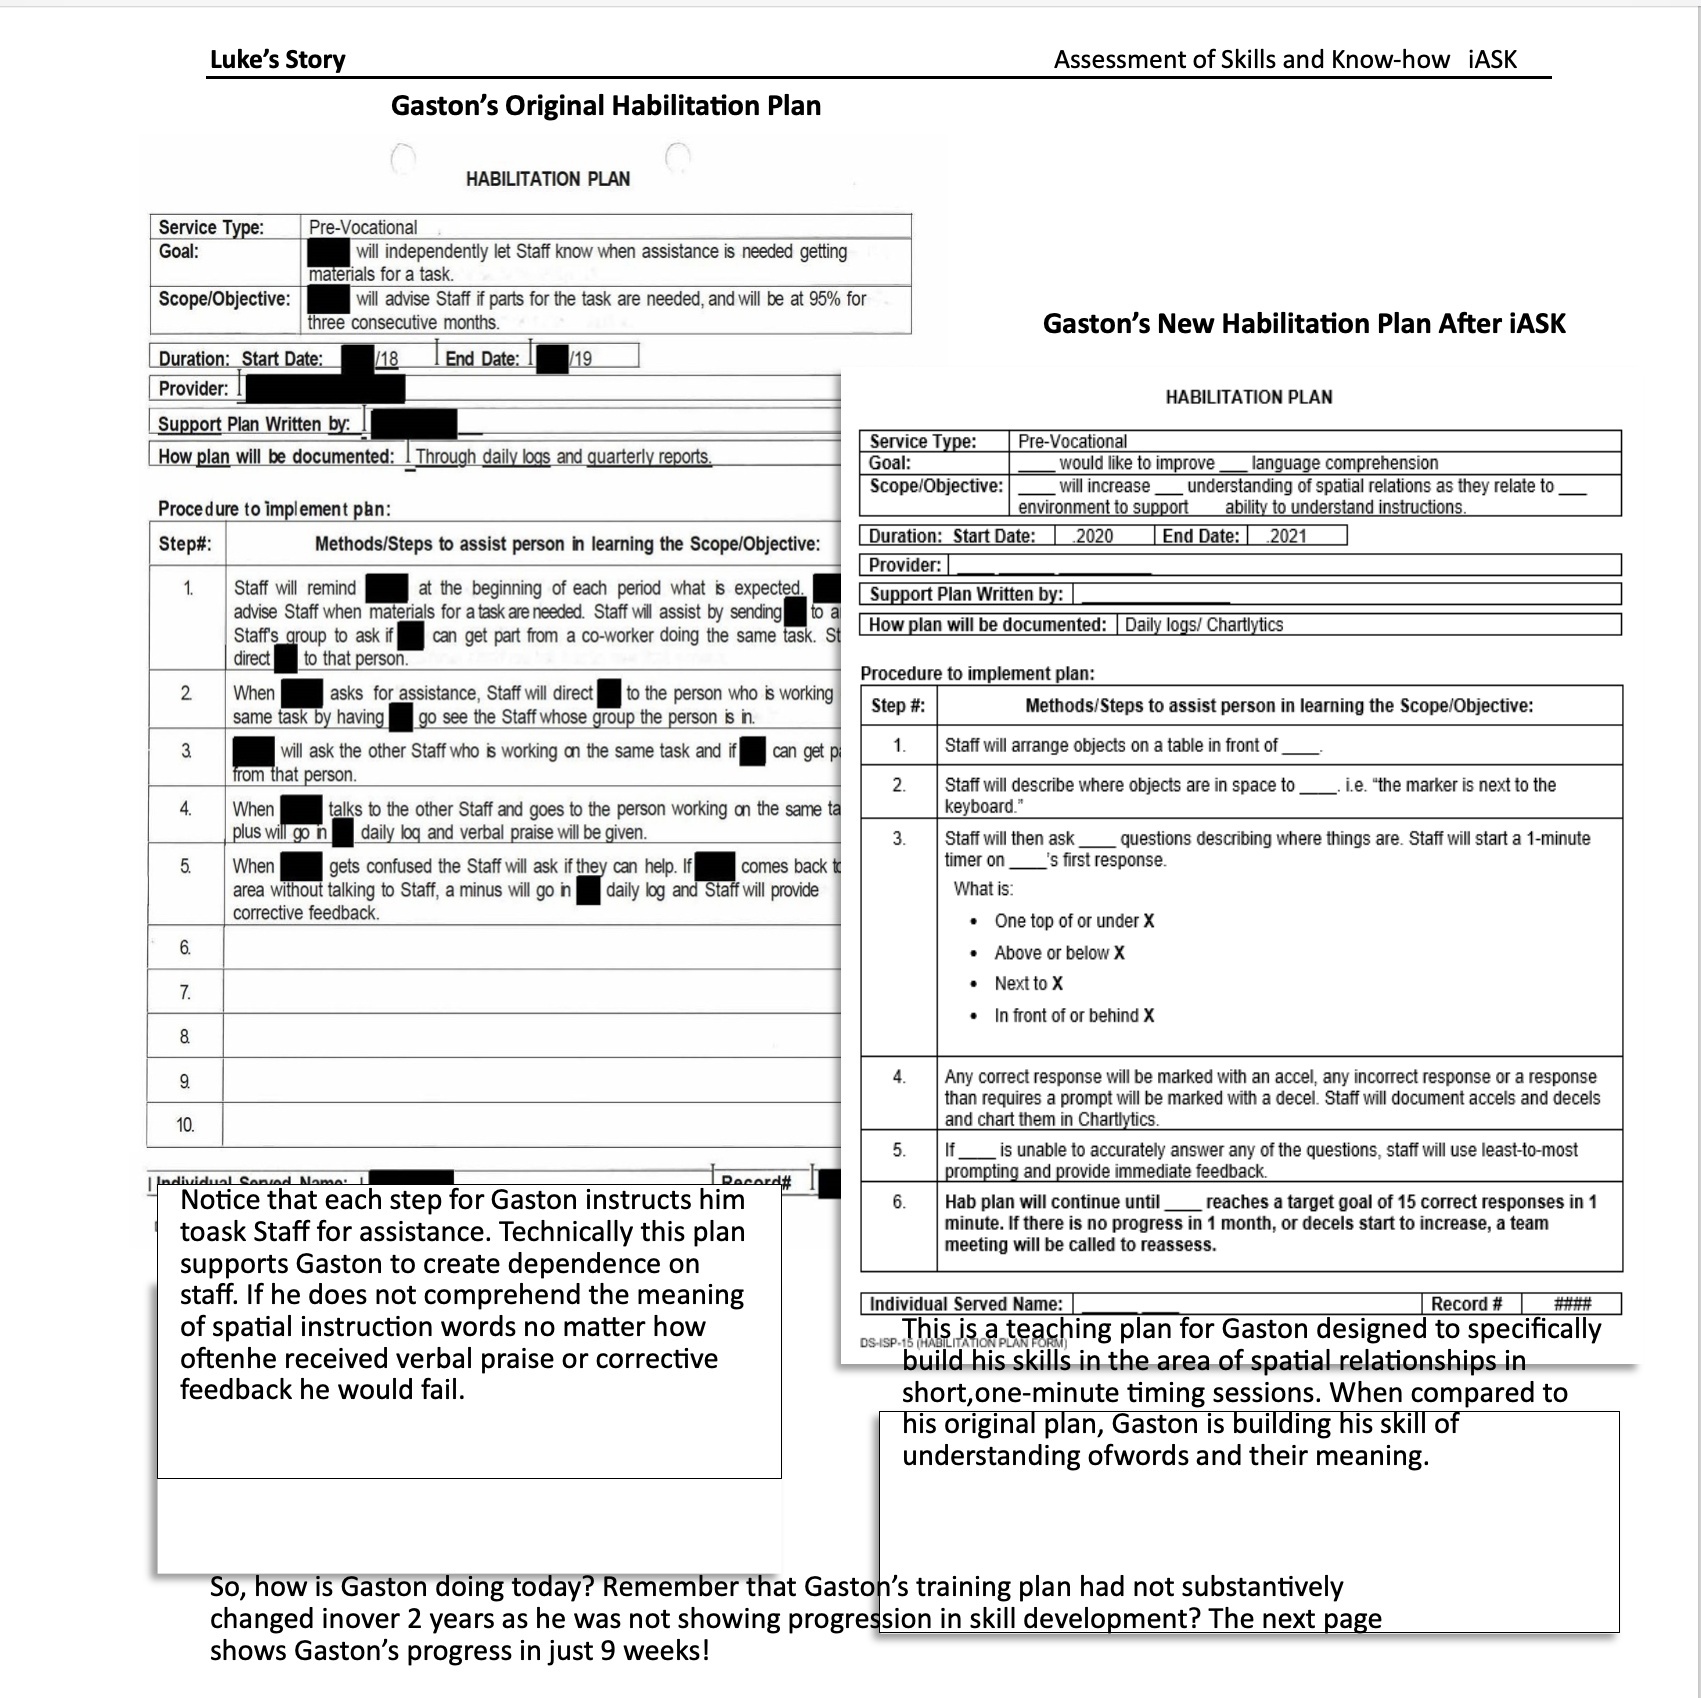
As a result of his iASK assessment and specific program guidance from the iASK Assessment Specialist, Gaston’s learning plan was changed dramatically. His before and after training plans (Habilitation Plan) appear on the next page.

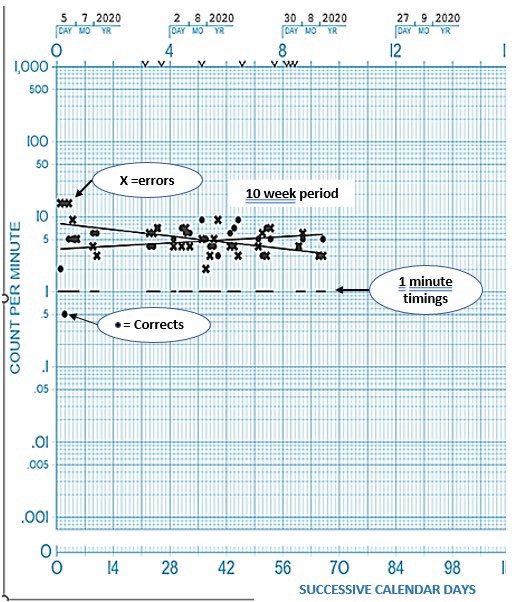
In addition to the skill gram, iASK generates a report using a Standard Celeration Chart (SCC). This is a graphing method far more sensitive in terms of tracking skill gains (accels) or errors (decels) when attempting a new skill. Gaston’s new program uses the SCC too.
Gaston’s Chart
At first, this Standard Celeration Chart (SCC) looks confusing, but let’s break it down. The philosophy behind The SCC is that learning gain is best tracked relative to a learner’s starting point. For example, 3 people found $1000 in the street…
- One is a child with $5 to their name
- One is a college student making $500 weekly
- One is Jeff Bezos, CEO of Amazon
Would finding $1000 have the same value for all of them or would finding $1000 be more meaningful to one vs another? What is a life-changing learning moment for one learner, maybe barely noticeable for another? The log scale helps a teacher detect progress (or not) at a glance.
The Y-axis is a base-10 logarithmic scale, “any number on the left side that has a one, is what you’re counting by, and what you’re counting from.” In Gaston’s case, his teacher was counting by one.
track his progress appears below:
The horizontal, or X-axis is time in weeks, the more
bold, blue vertical line represent Sundays. We can see that Gaston did not run his program in the third week because there are no dots or x’s. The dots are things we want to see more of, correct responses, the X’s are errors, things we want to see less of. The dots on Gaston’s chart represent correct answers to questions regarding the position of objects, the x’s incorrect ones.
His progress tracked this way shows a slightly upward trend. This line is called a “celebration line.” It tells us how much more fluent Gaston is getting each week. So we can tell in just 9 weeks (he missed the 3rd week) he’s getting about 10% faster in his correct responses per week, from 2 corrects per minute to 5.
Likewise, Gaston’s errors are going down by a rate of about 20% per week, indicated by the downward trend line that is following the x’s. He began this program making 18 errors per minute. In 9 weeks, he reliably only makes about 3 errors per minute. Gaston is learning, getting more accurate in his responses!
If this progress were compared to the outcome of his previous programs, Gaston is making demonstrable progress. We can project based on his rate of corrects and errors, Gaston will master this program in months, not years!

Conclusion
Humans are constantly changing as are their skills. iASK is intended to be used in part or comprehensively, over time, much like preventive medical assessments over time. iASK is an evidence-based system to improve the precision for both identifying specific skill strengths and deficits. The outcomes are to be used to improve learning plans. iASK used over time will show both skill acquisition increases (accuracy and rate of accurate completions) as well as skill decline when compared to prior assessments. iASK lays the foundation for a more successful learning process, centered on the needs of the learner while providing their team, their education/ development, possibly their medical professional, with measurable skill development plan recommendations.
